chromoMap


Annotate on chromosomes/chromosomal regions


and visualize feature-associated data.


Introducing new

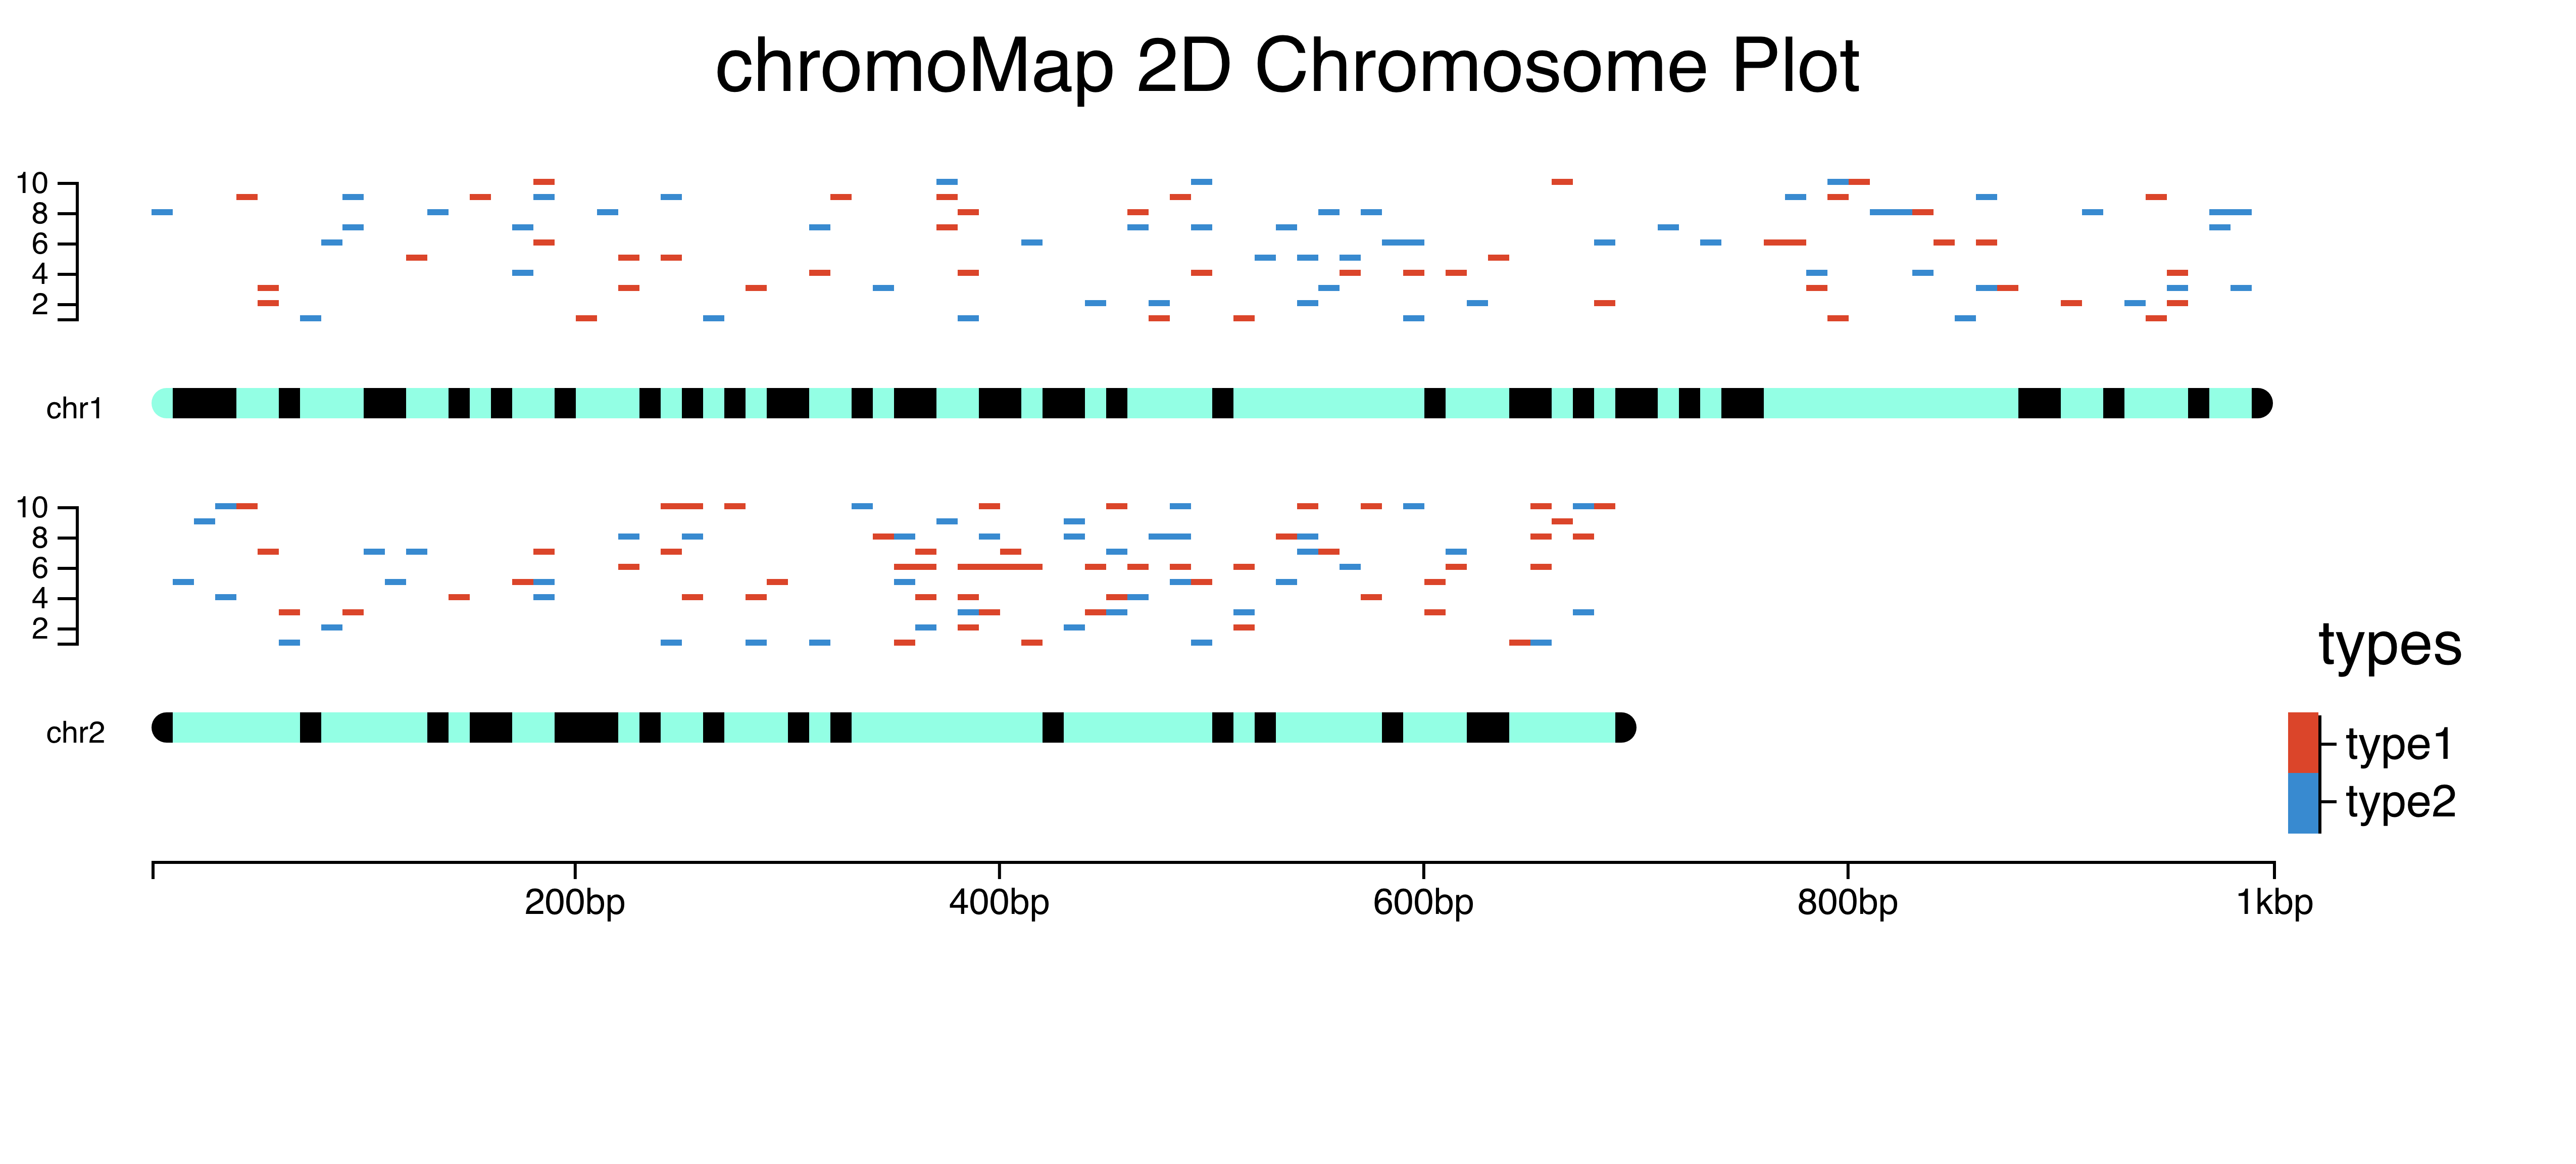
2D-Chromosome Plots


Visualize your annotations in 2D space.


Know more


new

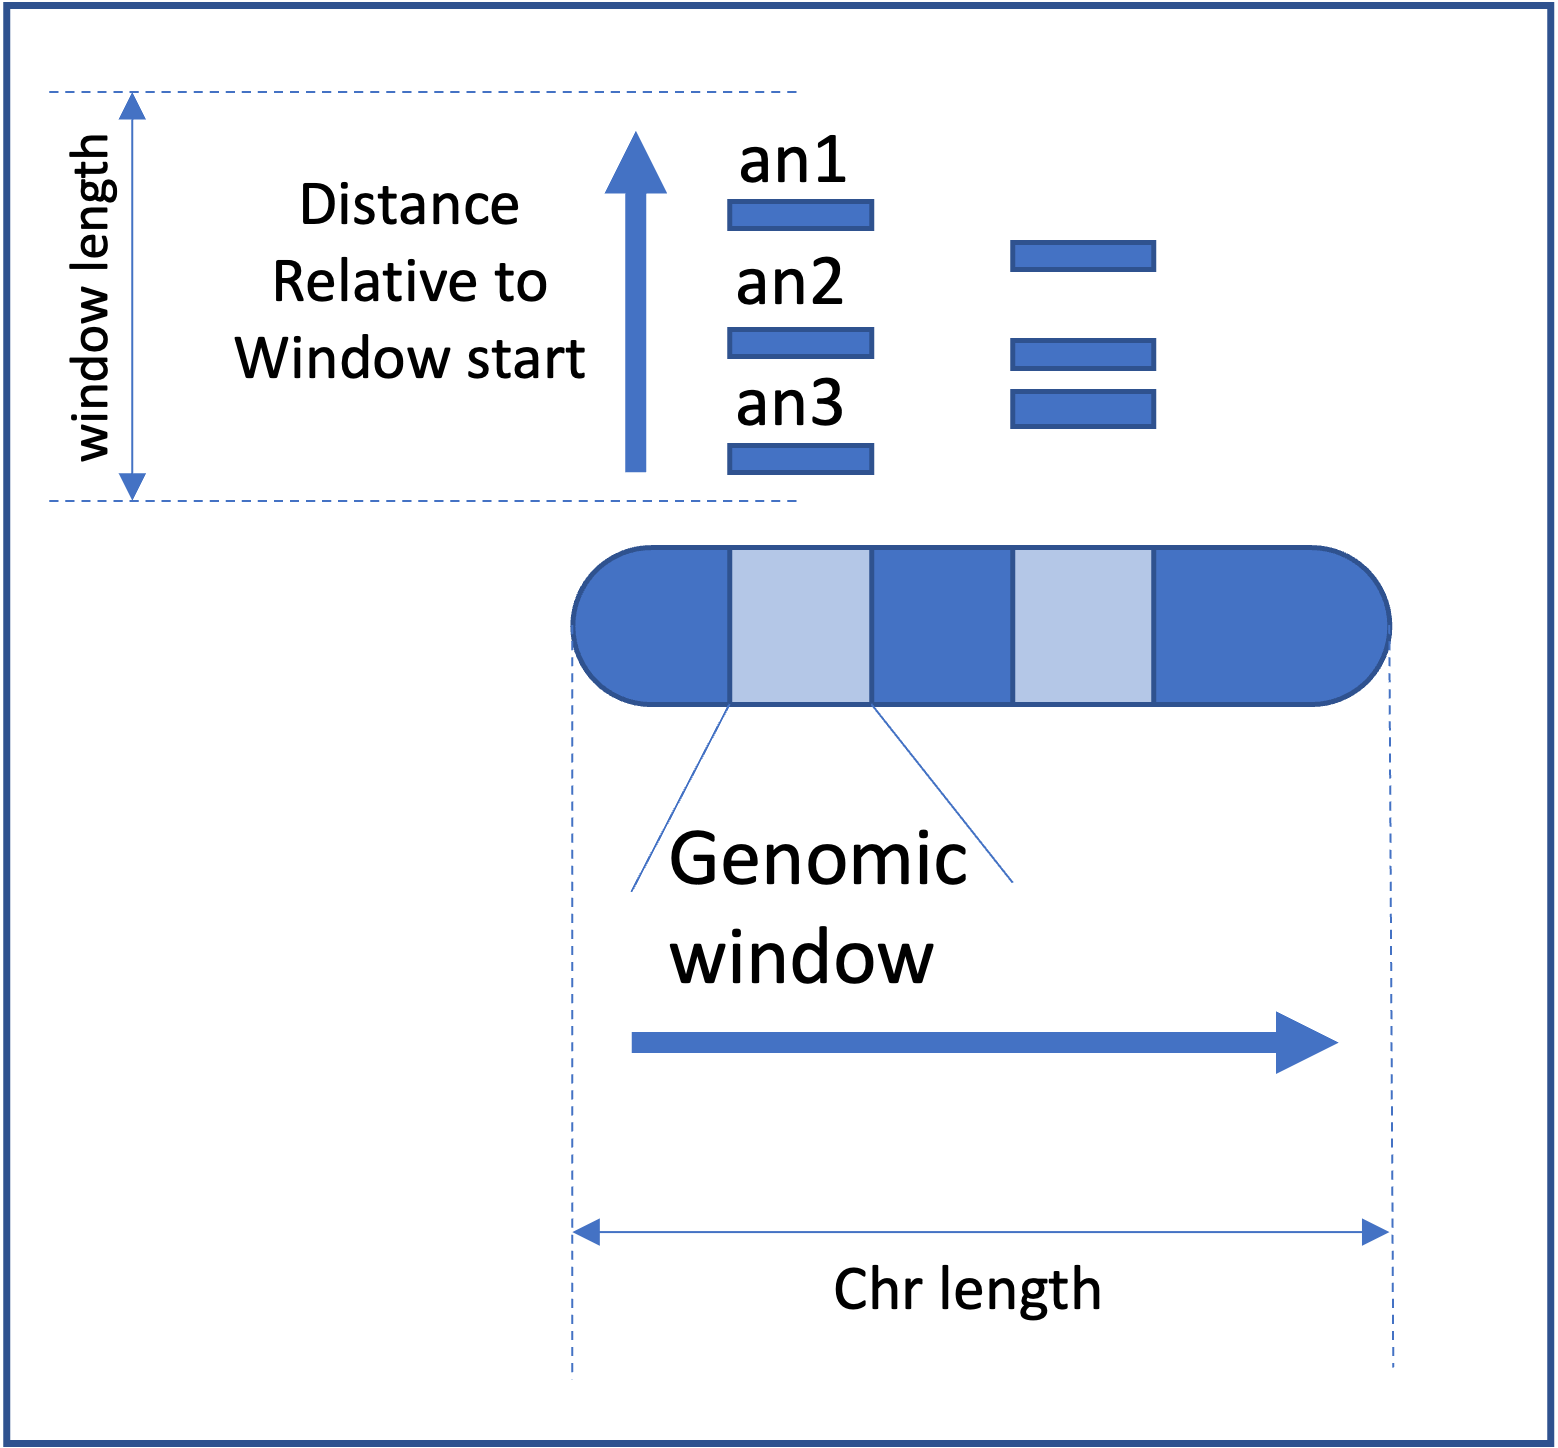
High-Resolution Maps


Increase number of genomic windows per chromosome


OR


Use a fixed window size


Know more

new

In-built Export Buttons


Export plots to PNG or SVG


Know more

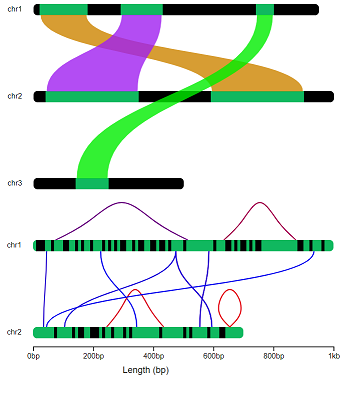
chromLinks Plots


Connect annotations using links.


Know more


Prominent Features


  • Visualize genes, genomes, or genomic regions of any living organism.


  • Polyploidy

  • Polyploidy allows visualization of different sets of chromosomes, differing in size and numbers, on the same plot. learn more

  • Chromosome Heat Maps

  • Visualize feature-associated data, like various multi-omics data, as heat colors on chromosomes. learn more

  • Bar and Scatter Plots

  • Visualize feature-associated data, for the annotated features, as either bar plots or scatter plots. learn more

  • epi-tags

  • Mark genomic loci with condition-based tags. learn more

  • Filters

  • Allows conditional-coloring of bar/scatter plots based on mathematical conditions on the data. learn more

  • chromLinks

  • visualize connections or links between loci. learn more

  • Discrete Color Maps

  • Visualize grouped annotations as discrete colors on the chromosomes. learn more

  • Labellings

  • Add labels to the chromosome plots. learn more

  • Hyperlinks

  • Add hyperlinks for annotated features. learn more

  • Highly Customizable

  • Tweak every aspect of the plot.


  • export options

  • export the plots as either standalone HTML documents or static images.